Article of the
Month - May 2021
|
Optimal Conditions for Satellite Derived
Bathymetry (SDB) - Case Study of the Adriatic Sea
Tea Duplančić Leder and Nenad Leder Croatia
 |
 |
| Tea Duplančić Leder |
Nenad Leder Croatia |
This article in .pdf-format (15 pages)
The article examines the optimal conditions required for the
implementation of the SDB method and tests them in the area of the
middle Adriatic sea basin (Murter channel).
SUMMARY
Sea depth data was by far the most
expensive spatial data. Traditional hydrographic surveys performed using
large and expensive research vessels have resulted in fact that at least
50% of the total global area of the continental shelf (shelf depth is
shallower than 200 m) was unsurveyed or surveyed with horizontal and
vertical inadequate accuracy defined according to IHO S-44 standards.
Therefore we need to find new methods of bathymetric survey. One of
these methods is relatively new method called “Satellite Derived
Bathymetry” (SDB), similar or sub variant to the LIDAR bathymetry survey
method. SDB uses satellite or other remote multispectral imagery for
depth determination. This method is founded on analytical modelling of
light penetration through the water column in visible and infrared
bands. In this research SDB will be used in the middle Adriatic Sea,
which has the specificity of the shallow archipelago sea. The research
of optical characteristics in the coastal area of the middle Adriatic
Sea, which cover channel areas and semi-enclosed bays which are far from
the river mouths, indicated that oceanic optical water type II was
observed (according to Jerlov classification) where euphotic zone (1%
PAR) reaches below 45 m. In this paper SENTINEL 2 satellites free of
charge data are used to estimate the sea depths in the wider area of
Murterski Kanal channel in the middle Adriatic Sea. It is concluded that
the depth gradients and coastline are actually very well surveyed by
using SDB method, while individual shoals are not revealed because of
the low spatial resolution of SDB method.
1. INTRODUCTION
It is very well known fact in the world hydrographic community that
the Moon's surface is better mapped than the Earth's seabed. We can
assume that at least 50% of the total global area of the continental
shelf (shelf depth is shallower than 200 m) was unsurveyed or surveyed
with inadequate horizontal and vertical accuracy, defined according to
IHO S-44 standards (IHO, 2008). Continental shelves make up about 8% of
the entire area covered by oceans and seas and the remaining parts have
a poorly defined sea bottom. Therefore, it is necessary to find
efficient and preferably coast effective methods of bathymetry
determination. One of the most efficient and the least expensive method
is satellite derived bathymetry (SDB) (Pe’eri et al., 2013).
Satellite Derived Bathymetry technique (SDB) is relatively new survey
remote sensing acquisition technique method, which uses high-resolution
multispectral satellite imagery or other remote multispectral imagery
for depth determination. Method has been recently considered as a new
promising technology in the hydrographic surveying industry, especially
for shallow water area acquisition. SDB is a survey method founded on
analytical modelling of light penetration through the water column in
visible and infrared bands. SDB data has potential to become most
important low cost source of a large number of spatial data including
hydrographic data also. Satellite-derived bathymetry procedure provides
a simple reconnaissance tool for hydrographic offices around the world.
The procedure is already in commercial use and its steps are documented
in public literature (Pe’eri et al., 2013). The satellite imagery
provides repeatable coverage of remote areas.
It should be pointed out that SDB method is suitable for bathymetric
survey of shallow coastal areas with clear water (approximately to the
depth of 2 secchi disc depth; e.g. Duplančić Leder et al., 2019), and
that accuracy of this method does not meet current IHO Standards for
Hydrographic Surveys (IHO, 2008).
The research of optical characteristics of the eastern Adriatic Sea
(Morović et al., 2008) indicated that offshore waters of the middle and
southern Adriatic mostly are the open-sea optical water type I according
to Jerlov classification (Jerlov, 1968) where euphotic zone (1% PAR)
reaches below 80 m. In the coastal area which cover channel areas and
semi-enclosed bays which are far from the river mouths, oceanic type II
was observed (Morović et al., 2008) where euphotic zone (1% PAR) reaches
below 45 m. Furthermore, annual coarse of monthly mean transparencies
(Secchi disk depth) for the middle Adriatic area demonstrate the range
between 8 and 13 m with maximum in early autumn (September) and minimum
in winter (January and February) (Morović, 2002).
It can be concluded that the coastal area of the middle and southern
Adriatic is convenient for the application of airborne/space-borne
techniques for the purpose of the bathymetric survey.
In this article we deal with Satellite Derived Bathymetry technique
(SDB), as relatively new survey remote sensing acquisition technique
method, which uses high-resolution multispectral satellite imagery for
depth determination in the coastal area of the middle Adriatic.
Sentinel-2 ESA observation mission was applied in the wider area of the
Murterski Kanal channel, situated in the middle of the Adriatic Sea.
2. SATELLITE DERIVED BATHYMETRY (SDB)
Satellite Derived Bathymetry (SDB) is a relatively new bathymetry or
seabed topography survey method, which first usage begins in the late
1970s. The frequency of its use has increased considerably in the last
few years (UKHO, 2015) with significant achievements of satellite
technology. Method uses satellite or other remote multispectral imagery
(unmanned aerial vehicles - UAVs, drones) for depth determination
(Marks, 2018). The method is especially effective for measuring shallow
areas, which represent a problem for the use of classical ultrasonic
acoustic (single beam and multibeam echo sounder) methods.
It should be mentioned that accuracy of SDB does not meet current
International Hydrographic Organization (IHO) S-44 standards (IHO,
2008). However, according to Pe’eri et al. (2013), it can be used when
planning hydrographic surveying of marine areas not surveyed or areas
with old data.
Since the data of some satellite missions is free or available for a
relatively small price, it can be said that this is almost the cheapest
source of spatial data in general. In particular, the rapid development
of this method has been accelerated using a relatively inexpensive and
effective unmanned autonomous vehicle (UAV) or drones. Sub variant
method so-called Airborne Derived Bathymetry (ADB) uses the same
methodology but the same restrictions apply as with SDB method.
Similar or second sub variant of SDB is LiDAR (Light Detection And
Ranging) bathymetry survey method. All of these techniques for
bathymetry survey (LiDAR, SDB or ADB) use a combination of two waves
(shortwave visible – blue or green and shortwave infrared), the first
one that penetrates well into the water column and the other which
reflects off the water surface. By measuring the difference between the
two returning waves, we can measure the depth of the sea.
2.1 SDB Limitations
The limitations of the SDB method are related to several significant
factors:
- Resolution of satellite or aerial images;
- Meteorological conditions;
- Water column reflection quality;
- Relationship between reflectance and DN (digital number) based
on threshold index.
These factors should be taken into account when selecting satellite
or aerial images.
2.1.1 Resolution of satellite or aerial images
Various remote sensing surveying technologies, particularly
high-resolution satellites, have been in operation in the last few
decades: multispectral satellite missions, LiDAR, and more recently,
unmanned aerial vehicles (UAVs, drones). The main goal of these
technologies is to observe and measure Earth physical parameter
(man-made objects, vegetation, atmospheric parameters…) and ultimately
mapping them. All of these technologies are being used across various
platforms today as shown on the left side of Figure 1 (Yamazaki & Liu,
2016).
The spatial and temporal resolutions of remote sensing technologies
also have a wide range, as shown on the right side of Figure 1 which
shows the observation range, as a cube defined by three sensor
parameters (without sensor spectral aspect): (1) the spatial resolution,
expressed in GSD (Ground Sampling Distance), (2) data acquisition
frequency or revisit time, and (3) object range, the average distance
between the sensor and the object space observed (Toth & Jóźków, 2016).
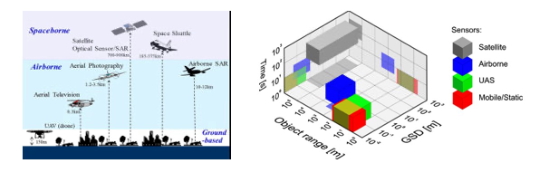
Figure 1. Various platforms and sensors used for
remote sensing (left; according Yamazaki & Liu, 2016); Remote sensing
observation cube (right; according Toth & Jóźków, 2016).
One of the most important limitations of this technology is
sensor-dependent spatial resolution (Table 1). The remote sensing
surveying technologies for observations and recordings of Earth
parameters mainly have been used digital aerial cameras, which main
characteristics are higher radiometric and spatial resolution than usual
digital cameras.
For better results, the SDB method should be used on commercial
satellite data in which the current image resolution reaches up from 0.5
to 0.3 m (WorldView 3&4; Table 1; Figure 2). SDB is cost effective and
rapid survey method. This is independent technology, supporting
uncertainty estimation. SDB cost generally depends on costs of satellite
images, which are between 0 (free of charge) and 60 €/km2, depending on
image quality.
Table 1. Spatial resolution and the cost of
individual satellite scenes used for SDB (according ARGANS, 2016) with
personal data
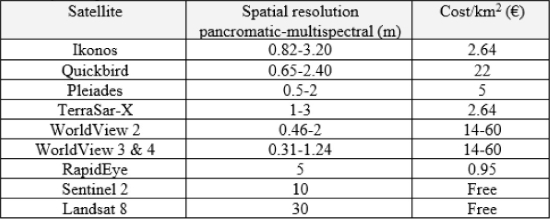
The spatial resolution achieved with this technology varies depending
on the used satellite images. Today, SDB uses free Landsat 8 images with
30 m spatial resolution, through to Worldview at 1.25 m. The vertical
accuracy achieved is approximately 10 - 15% of the depth and
significantly reduced in areas with depths above 20-30 m. Figure 2
present SDB technology performed by different spatial resolution
satellite images WorldView3 (above) and Landsat 8 (below) on Majuro
Atoll of Marshall Islands presented at USGS EROS Workshop 2017 (Kim,
2017).
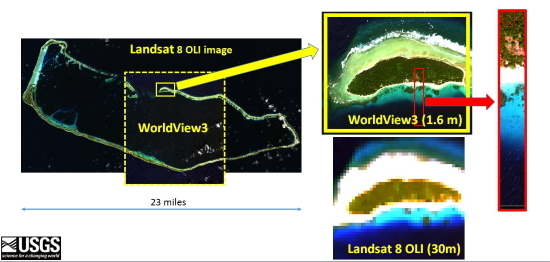
Figure 2. Majuro Atoll, Marshall Islands images
obtained with different satellite resolutions (Kim, 2017).
2.1.2 Meteorological conditions
Electromagnetic energy passes through the atmosphere twice, first it
is downwelling radiation from the Sun and second time is upwelling
radiation from the Earth to the sensor (Figure 3). Different physical
processes take place along this path, they are called meteorological
conditions at the time of image recording and which very often depend on
the height of the sun and the state of the atmosphere or the amount of
specific particles in the atmosphere. Meteorological conditions at the
time of shooting affect the quality of a satellite images and
consequently are critical to the SDB method solving. Most affected
processes are:
- Absorption (performed by different atmospheric particles: CO2,
H2O, O2, O3) which reduces the energy intensity and blur the image,
and
- Scattering (Rayleigh, Mie and nonselective scattering) that
occurs on different sizes particles in an atmosphere which redirect
EM energy.
Ideal meteorological conditions are around noon on a sunny, dry day
with no clouds and no pollution therefore, when selecting remote sensing
images for SDB method, approximately similar conditions should be
chosen.
Influences of meteorological conditions at the time of shooting effects
are being removed by atmospheric modeling method which corrects
atmospheric disturbances with specific atmospheric data knowledge
(temperature, pressure, moisture, aerosol content, etc.). The
atmospheric modeling method use dark object subtraction, which assumes
the existence of zero or small surface reflectance, for correct for
atmosphere disturbances on image or atmospheric correction. The method
works so that minimum digital number (DN) value in the histogram from an
entire scene is subtracted from all pixels. There are also few radiative
transfer models (LOWTRAN7 atmospheric absorption extinction model
(https://pypi.org/project/lowtran/), MODTRAN - MODerate resolution
atmospheric TRANsmission (http://modtran.spectral.com/),
etc.) to correct images. Atmospheric correction removes the scattering
and absorption effects from the atmosphere.
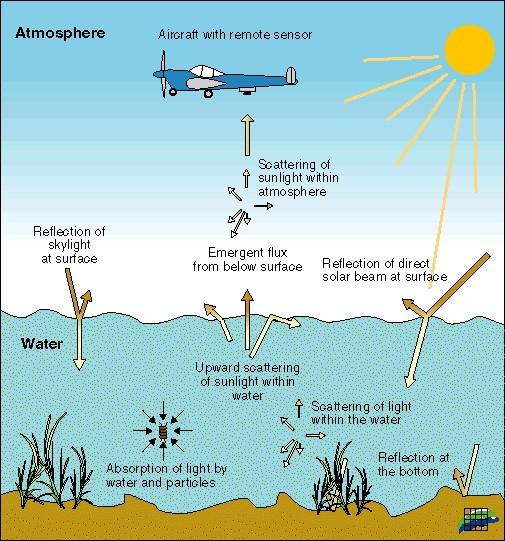
Figure 3. Atmospheric and water column effects on
remote sensing data (according
https://www.dmu.dk/rescoman/project/Backgrounds/challenges.htm).
2.1.3 Water column reflection quality
SDB method to depth determination use analytical modeling of light
penetration through the water column in visible and infrared bands
(Figure 3). Electromagnetic radiation is absorbed and it scatters while
spreading through water and residue energy has been backscattered and
recorded in satellite (Stumpf et al., 2003). The method efficacy depends
on the water optical properties in the coastal area, such as absorption
coefficients of suspended and dissolved substances, attenuation,
scattering and backscatter and bottom reflections (Vinayaraj, 2017). The
combinations of analytical and empirical models provides an algorithm
that is most commonly used to determine depths (Lyzenga et al., 2006;
Vinayaraj et al., 2016), which depends significantly of optical water
properties especially water spectral properties.
Water color (clarity), which can be determined by visual methods
(Figure 4) or in a satellite imagery is an indicator of water column
transparency. SDB method is strongly depending on water clarity and
found to be range of 1 - 1.2 Secchi disc depth (Duplančić Leder et al.,
2019). Before starting to use this method someone would find an ideal
image, which depends on seasonal dynamics, water turbidity, bottom
topography and other water column parameters.
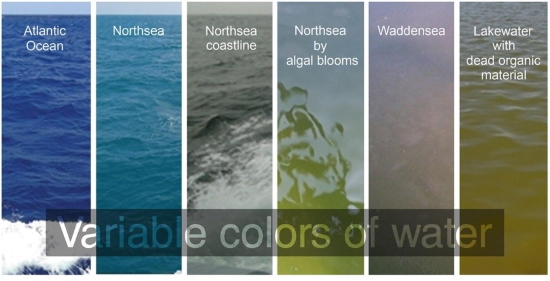
Figure 4. Variable colors of water (according
https://forelulescale.com/).
In general reflection quality of electromagnetic radiation depends on
water column transparency, the topography and sedimentological
characteristics of the sea bottom (Figure 5).
SDB method use is not recommended in coastal waters with weak bottom
reflection and high turbidity.
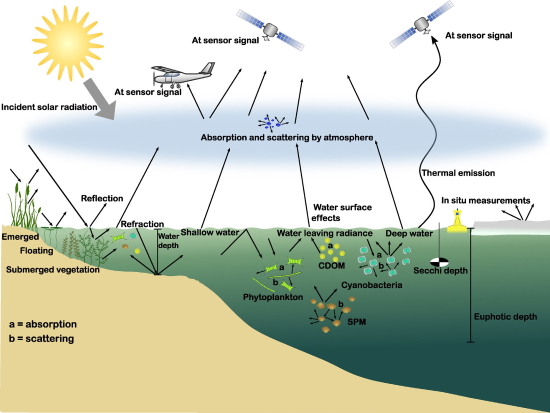
Figure 5. Interaction between radiation, remote
sensing indicators of lake ecology and sensors (according Dörnhöfer &
Oppelt, 2016).
2.1.4 Relationship between reflectance and DN based on
threshold index
SDB algorithm in determining depth used threshold index determination
and there are no universal threshold values or formulae for classifying
water bodies based on indices, especially in complex water bodies.
Threshold index depends on the optical properties and other water
components such as phytoplankton, suspended matter, biological season
changes, water pollution etc. Threshold values are also different in
different wavelength bands.
Threshold index depends on physical (depth, clarity, etc.), chemical
(saline, fresh, etc.), biological (algal infested etc.), thermal
(temperature etc.), geological and human impact factors (Ji et al.,
2009; Zeng et al., 2016; Patra et al., 2011).
3. SENTINEL-2 OBSERVATION MISSION
Sentinel-2 is European Space Agency (ESA) Earth observation mission
as part of the Copernicus Program. Sentinel-2A was launched on 23 June
2015 and Sentinel-2B was launched on 7 March 2017 from French Guiana.
Mission performs terrestrial observations to support services such as
forest monitoring, land cover changes detection, and natural disaster
management. All Sentinel mission data can be downloaded through
Copernicus Open Access Hub and USGS EarthExplorer.
Mission consists of two identical satellites, Sentinel-2A and
Sentinel-2B. Satellites orbit is Sun synchronous at 786 km (488 mi)
altitude and 14.3 revolutions per day. The orbit inclination is 98.62°
and the Mean Local Solar Time (MLST) at the descending node is 10:30
(am). The Sentinel-2 swath width is 290 km.
Temporal resolution of this mission is 10 days with one satellite, and 5
days with 2 satellites. Sentinel-2 is multi-spectral mission with 13
bands in the visible, near infrared, and short wave infrared part of the
spectrum and spatial resolution of 10 m, 20 m and 60 m (Figure 6) and
12-bit radiometric resolution
(https://sentinel.esa.int/web/sentinel/missions/sentinel-2).
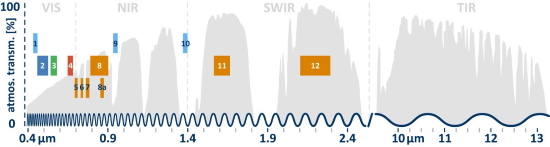
Figure 6. Sentinel 2 bands (according
https://blogs.fu-berlin.de/reseda/sentinel-2/).
4. STUDY AREA
The Murterski Kanal channel (Figure 7) is situated in the middle of
the Adriatic Sea at 43°48′30″N 15°37′00″E. The channel leads between the
mainland coast and the island of Murter. The narrows at Tisno (Murterski
Tjesnac) are spanned by a swing bridge (Figure 7) which connects the
island with the mainland (HHI, 2004).
NW part of the Murterski Kanal (up to the bridge) is much shallower than
the SE part. Only in the middle part of the channel depths are between 8
and 11 m along and the coast is shallow. SE part of the Murterski Kanal
is full of shoals and islets that are mostly well visible, but nearby
area is very shallow. In the SE part of the Murterski Kanal depths are
generally deeper than 20 m.
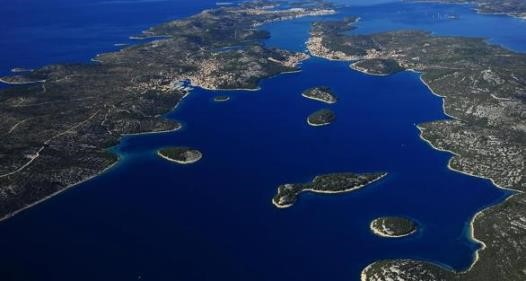
Figure 7. Murterski Kanal
channel.
http://zasticenapodrucja.com/UserFiles/Image/gallery/586x313/murterski-kanal-m-jpg.jpg
5. RESULTS
In this analysis, from several satellite scenes from different
seasons (January, September, April and March), the scene that gives the
best results is selected. It is Sentinel 2 scene, recorded on 03 January
2020; pass 11h 16 min 12 sec (Figure 8). Metrological and weather
conditions at the shooting time were: air temperature 10.4 °C; air
pressure: 1027.0 hPa; dew point: -5.4 °C; relative humidity 34.4%; wind
direction and speed: 100°, 1m/s and zenith solar angle
(68.1605209470205) (https://earthexplorer.usgs.gov/).
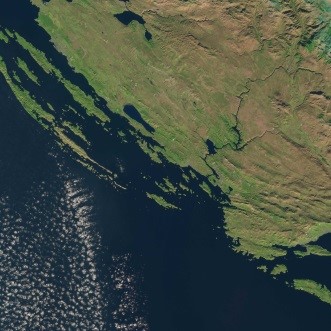
Figure 8. Sentinel 2 scene on 03 January 2020
(according
https://earthexplorer.usgs.gov/).
Figure 9 illustrate the estimated water depths of the wider area of
Murterski Kanal channel computed by the satellite bathymetry model
developed by Stumpf et al. (2003) from Sentinel 2 satellite images. In
Figure 9 the depths are shown in the color range from 0 m (red) to 50 m
(dark blue). By comparing the bathymetric map (depths and depth contours
in the background) with ENC HR400512, it can be concluded that the depth
gradients and coastline are actually very well surveyed by using SDB
method, while individual shoals are not revealed because of the low
spatial resolution of SDB method.
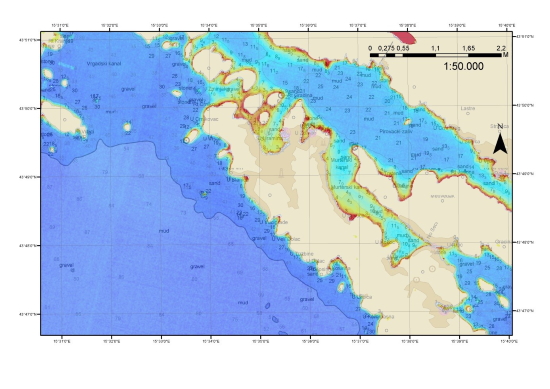
Figure 9. Satellite-derived water depths in the
Murterski Kanal channel obtained from Sentinel 2 satellite images on 03
January 2020.
6. CONCLUSION
Traditional hydrographic surveys performed using large and expensive
research vessels are not sufficient to provide high-quality sea depth
data, especially in shallow coastal areas, all for the purpose of
ensuring safe navigation. Therefore hydrographers need to find new
methods of bathymetric survey. One of these methods is relatively new
method called “Satellite Derived Bathymetry” (SDB), which uses
high-resolution multispectral satellite imagery or other remote
multispectral imagery for depth determination. SDB method is one of the
most efficient and the least expensive method for bathymetry
determination in shallow coastal areas. In this paper SENTINEL 2
satellites free of charge data were used to estimate the sea depths in
the wider area of Murterski Kanal channel in the middle Adriatic Sea,
because scientific oceanographic research indicated this area as oceanic
optical water type II where euphotic zone reaches below 45 m. Because
SDB method is founded on analytical modelling of light propagation from
sensor through the atmosphere and the water column and back, several
satellite scenes were analyzed in different seasons, to find the scene
that gives the best result. The analysis of the results came to a
conclusion that the depth gradients and coastline of the area of
Murterski Kanal channel are actually very well surveyed by using SDB
method, while individual shoals are not revealed because of the low
spatial resolution of SDB method. Generally it can be concluded that SDB
method is suitable for bathymetric survey of shallow coastal area of
Murterski Kanal channel, where usually clear water was observed, and
that accuracy of this method does not meet current IHO Standards for
Hydrographic Surveys for safe navigation. Consequently, the SDB method
is suitable for determination of bathymetric data in areas without
bathymetric data or in areas with old bathymetric data, for the purpose
of planning the survey.
REFERENCES
ARGANS, 2016, SDB Developments - seen from an R & D perspective,
NSHC32 Dublin, available at:
https://www.iho.int/mtg_docs/rhc/NSHC/NSHC32/NSHC32-C.7.1_SDB_
ARGANS.pdf, [accessed 10 February 2019.]
Dörnhöfer, K., & Oppelt, N., 2016, Remote sensing for lake research
and monitoring – Recent advances, Ecological Indicators, 64, 105–122.
doi:10.1016/j.ecolind.2015.12.009.
Duplančić Leder, T., Leder, N. & Peroš, J., 2019, Satellite Derived
Bathymetry survey method – Example of Hramina Bay, Transactions on
Maritime Science, Vol. 8, No. 1, 99-108 DOI 10.7225/toms.v08.n01.010
HHI, 2004, Adriatic Sea Pilot, Volume II, Hydrographic Institute of
the Republic of Croatia.
IHO, 2008, IHO standards for hydrographic survey: Special Publication
No. 44, 5. Edition, International Hydrographic Bureau, Monaco, p. 36.
Jerlov, N., 1968, Optical oceanography, Elsevier, Amsterdam, 1-194.
Ji, L., Zheng, L., Wylie, B., 2009, Analysis of Dynamic Thresholds
for the Normalized Difference Water Index, Photogrammetric Engineering &
Remote Sensing, Vol. 75, No. 11, 1307–1317.
Kim, M., 2017, JALBTCX Workshop 2017 USGS EROS (https://www.usgs.gov/land-resources/eros/coned/science/satellite-derived-bathymetry?qt-science_center_objects=0#qt-science_center_objects)
[accessed 4 February 2020.]
Marks K.M., 2018. IHO-IOC GEBCO Cook Book - 2018 Progress Report,
NOAA Laboratory for Satellite Altimetry, College Park, Maryland, USA, p.
429.
Morović, M., Grbec, B., Matić, F., Bone, M. & Matijević, S., 2008,
Optical characterization of the eastern Adriatic waters, Fresenius
environmental bulletin (17), 1679-1687.
Morović, M., 2002, Seasonal and interannual variations in pigments in
the Adriatic Sea. Proc. Indian Acad. Sci. (Earth Planet. Sci.) 111,
215-225.
Patra, S., Ghosh, S., Ghosh, A., 2011, Histogram thresholding for
unsupervised change detection of remote sensing images, International
Journal of Remote Sensing, Vol. 32., No. 21., 6071-6089.
Pe’eri, S.; Azuike, C., & Parrish, C., 2013. Satellite-derived
Bathymetry – A Reconnaissance Tool for Hydrography, Hydro International,
10, pp. 16-19.
Stumpf, R.P., Holderied, K. & Sinclair, M., 2003, Determination of
water depth with high-resolution satellite imagery over variable bottom
types, Limnology and Oceanography, 48 (1), pp. 547–556.
UKHO, 2015. Satellite Derived Bathymetry as Source Data for
Navigational Charts. Available at:
https://www.iho.int/mtg_docs/com_wg/CSPCWG.
Vinayaraj, P., 2017, Development of Algorithms for Near-shore
Satellite Derived Bathymetry Using Multispectral Remote Sensing Images,
PhD Thesis, available at:
http://dlisv03.media.osaka-cu.ac.jp/contents/osakacu/kiyo/
111TDA3657.pdf, [accessed 10 February 2019.].
Vinayaraj, P., Raghavan, V. & Masumoto, S., (2016), Satellite derived
bathymetry using adaptive-geographically weighted regression model,
Marine Geodesy, 39 (6), pp.458-478.
Yamazaki, F. & Liu, W., 2016, Remote Sensing Technologies for
Post-Earthquake Damage Assessment: A Case Study on the 2016 Kumamoto
Earthquake, 6th ASIA Conference on Earthquake Engineering (6ACEE) 22-24
Sept 2016, Cebu City, Philippines, 1-13.
Toth, C., & Jóźków, G., 2016, Remote sensing platforms and sensors: A
survey. ISPRS Journal of Photogrammetry and Remote Sensing, 115, 22–36.
doi:10.1016/j.isprsjprs.2015.10.004.
Zhang, F., Li, J., Shen, Q., Zhang, B., Ye, H., Wang, S., Lu, Z.,
2016, Dynamic Threshold Selection for the Classification of Large Water
Bodies within Landsat-8 OLI Water Index Images. Preprints 2016,
2016120141 (doi: 10.20944/preprints201612.0141.v1) [accessed 4 February
2020.]
BIOGRAPHICAL NOTES
Tea Duplančić Leder, born in Split in 1960, graduated at the Faculty
of Geodesy the University of Zagreb. She completed her internship in
1986 at Elektrodalmacija Split, and then worked at the high school for a
half year. She worked at the Hydrographic Institute from 1988 to 2007 in
various positions. In 2002, she completed a specialized course at the
International Maritime Academy (IMA) in Trieste for the production and
maintenance of Electronic Navigation Charts, and in 2005 she attended
specialist training at C-map Italy for quality control and validation of
ENC data. She received her PhD in 2006 from the Faculty of Geodesy,
University of Zagreb, entitled “New Approach to the Making of Electronic
Navigation Charts in Croatia”.
Since 2007, she has been employed at the Faculty of Civil Engineering
and Architecture in Split, and in 2010, she was elected Vice-Dean for
the study of Geodesy and Geoinformatics at the same Faculty. She
performed the function until 2016.
Nenad Leder, born in Komiža (Vis island, Croatia) in 1958, graduated
in 1981 at the Faculty of Science of the University of Zagreb,
Department of Physics. His professional career as oceanographer and
hydrographer spans some 35 years at the Hydrographic Institute of the
Republic of Croatia. Between 2004 and 2014 he took up the post of
Assistant Director and between 2014 and 2017 he was the Director. As
National Hydrographer he was Croatian government’s representative at the
International Hydrographic Organization (IHO) in Monaco.
In October 2004 he earned his doctor’s degree with the dissertation
entitled "Barotropic and Baroclinic Waves in Wider Area of Lastovo
Channel". In the period between 2005 and 2009 he performed the duties of
project manager in CRONO HIP Project (Croatian-Norwegian Hydrographic
Information Project), through which the Hydrographic Institute of the
Republic of Croatia significantly modernized its ”production line“ from
the hydrographic survey by modern multibeam echosounder, and
implementation of sophisticated database of hydrographic, nautical and
oceanographic data, to the production of electronic navigational charts
(ENC) and paper navigational charts from the same database.
From 2017 to the present he is an assistant professor at the Faculty of
Maritime Studies of the University of Split.
CONTACTS
Prof. Tea Duplančić Leder
Faculty of Civil Engineering, Architecture and Geodesy, University of
Split
Matice hrvatske 15
21000 Split
CROATIA
Web site: http://gradst.unist.hr/
Ass. Prof. Nenad Leder
Faculty of Maritime Studies, University of Split
Ruđera Boškovića 37
21000 Split
CROATIA
Web site:
http://www.pfst.unist.hr/hr/


